
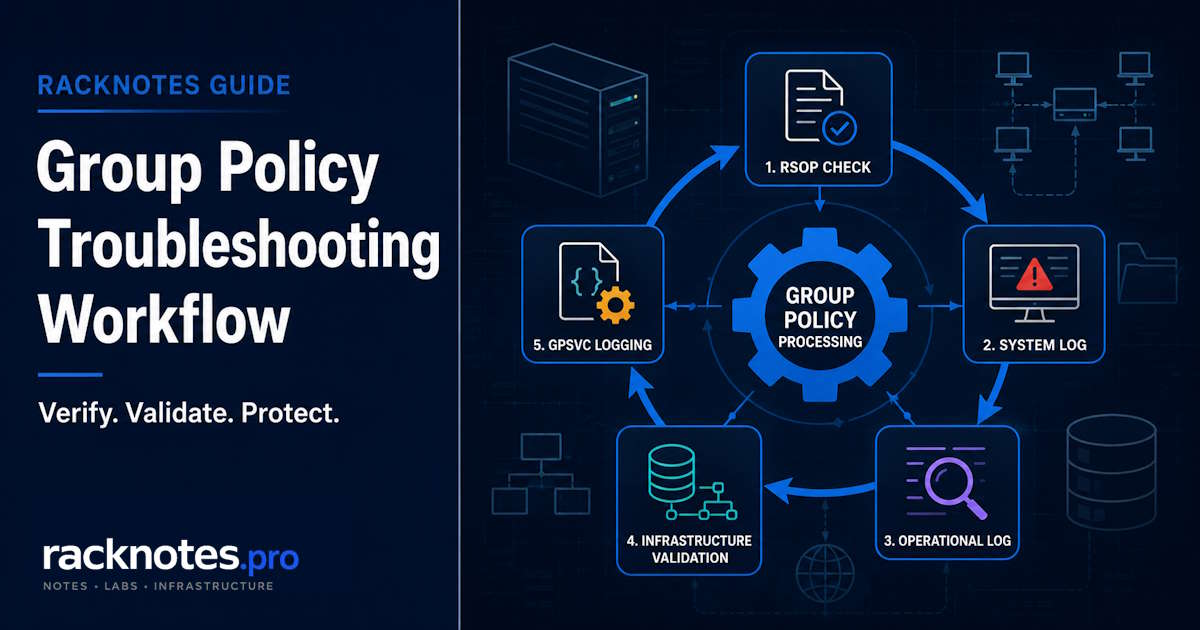
Group Policy troubleshooting slows down when the investigation starts in the wrong place: opening the GPO editor before defining the scope of the problem, or scrolling through raw event logs before isolating the processing instance that actually failed. A practical workflow combines two views of the same problem: RSoP shows what Windows evaluated, and the event logs show how that processing succeeded or failed.
To troubleshoot Group Policy, start by defining the affected user, computer, and scope. Check applied and filtered GPOs with GPResult or Group Policy Results, review the System and Application logs, then use the Activity ID to isolate the matching Group Policy Operational events. Follow the evidence into filtering, precedence, refresh, file retrieval, or infrastructure troubleshooting.
Microsoft’s formal troubleshooting checklist starts with the System and Group Policy Operational logs. This guide places a short RSoP check first as a fast routing step, not as a replacement for that official event-log workflow.
- Define the affected scope first: object, setting, Computer vs User side, and what changed recently. Scope determines which evidence to collect first, but it does not replace collecting that evidence.
- Use
gpresult /ror Group Policy Results for a fast RSoP view of applied and filtered GPOs. - Check the System log for Group Policy warnings or errors and record the Activity ID. Follow direct evidence immediately when Windows has already recorded an error.
- Correlate that Activity ID against the
Microsoft-Windows-GroupPolicy/Operationallog to see the real processing timeline for that one instance. - Escalate to DNS, domain-controller connectivity, SYSVOL, and replication as soon as the evidence points there, not after every client-side branch is exhausted.
- Use GPSvc debug logging only when the standard logs don’t explain the failure. It’s a deeper, noisier diagnostic layer, not a first step.
Group Policy Troubleshooting Workflow at a Glance
The steps below move from scope definition to RSoP confirmation, correlated event-log analysis, failure-branch routing, infrastructure validation, and verbose service logging when deeper evidence is required.
- Define the symptom and affected scope.
- Confirm applied and filtered GPOs with GPResult or Group Policy Results.
- Review System and Application log events.
- Filter the Operational log by Activity ID.
- Interpret the correlated Operational events.
- Identify the failure branch and follow the matching troubleshooting guide.
- Escalate to infrastructure only when the evidence points there.
- Use GPSvc debug logging only as a deeper layer, and preserve evidence before making changes.
Step 1: Define the Exact Symptom and Scope
Before collecting logs or command output in any troubleshooting session, record:
- the specific setting or preference item that is missing;
- whether it is under Computer Configuration or User Configuration;
- the affected user, computer, OU, and AD site;
- whether one object, one OU, or the whole domain is affected;
- the last time the setting worked;
- whether the problem began after an OU move, group-membership change, GPO edit, domain-controller change, or Windows update.
“One computer fails” and “every computer in an OU fails” point in different directions, but neither pattern proves the cause on its own. Use the affected scope to decide which evidence to collect first, not to skip evidence collection.
Step 2: Confirm Applied and Filtered GPOs With RSoP
gpresult /r and the Group Policy Results Wizard in GPMC read the same Resultant Set of Policy data. The command line is faster for a quick check, and the wizard is easier to browse for winning-GPO and precedence detail across a longer settings list. Group Policy Modeling is a different tool: it simulates a predicted result for planning, and it does not evaluate Local GPOs, so it answers a different question than RSoP.
This step answers a narrow question: did the expected GPO appear in the applied or filtered set for this specific user or computer? If it appears in neither list, first verify the report context, object location, links, inheritance, and disabled GPO sections. Treat the absence as a routing clue rather than proof of one cause; the System and Operational logs may still be needed, especially when replication or policy enumeration is involved.
Full command syntax, switches, remote-query options, and RSoP error fixes are covered in the GPResult command guide. If the expected GPO is missing or filtered, use Step 6 to move to the appropriate diagnosis guide.
Step 3: Read the System and Application Logs
The System log is Microsoft’s primary starting point for Group Policy service warnings and errors. Look for events from the Group Policy source, note the severity, and open the event’s Details view.
These event IDs are common routing points in this workflow:
| Event ID | What it generally indicates |
|---|---|
| 1129 | No connectivity to a domain controller |
| 1006 | LDAP bind or authentication failure (check the Details-tab error code: 5, 49, 258) |
| 1097 | Windows could not determine the computer account required to enforce computer policy; check event details, time synchronization, the computer account, and secure channel |
| 1058 | Failure reading a Group Policy file such as gpt.ini (check error code 3, 5, or 53) |
| 1096 | The Registry client-side extension failed to apply a setting; inspect the error details and FilePath when present before assuming local corruption |
| 1053 | Windows could not resolve the user or computer name; inspect the error code and distinguish name resolution from AD replication or account lookup issues |
Event ID 1096 detail varies by Windows build. Recent Windows builds provide enhanced registry-policy parsing descriptions in the event details, while older Windows and Windows Server builds may require the error code and the GPSvc log to identify the affected file.
Each event leads to a different group policy troubleshooting branch. GPUpdate /Force Not Working covers Event IDs 1129, 1006, 1097, and 1096 in the context of refresh failures. Event ID 1058 needs its own file-retrieval decision tree based on the exact DC path and error code, covered in Group Policy Event ID 1058. Use the event as a routing signal, then follow the troubleshooting branch that matches the recorded error.
When to Check the Application Log
The System log is not the only standard log. Group Policy Preferences events are written to the Application log, so check it when:
- a Group Policy Preferences item fails;
- the affected client-side extension writes item-level details there;
- the summary System event does not contain the component-specific error;
- the setting appears applied at the GPO level but the individual item is still missing.
Keep Application events from the same timestamp together with the matching System and Operational evidence.
One of the most useful fields in the System event is the Activity ID in the Details/Friendly view. That value connects this one event to the full processing instance in the Operational log.
Step 4: Filter the Group Policy Operational Log by Activity ID
Microsoft-Windows-GroupPolicy/Operational, under Applications and Services Logs, is where the actual processing timeline lives. Unfiltered, it’s noisy, because every boot, logon, and background refresh generates its own set of events with its own Activity ID.
The practical method:
- Find the Activity ID on the relevant System log event, in Details view, under Friendly View, in the System section.
- Build a custom view in Event Viewer filtered to the Operational log and that specific Activity ID.
- Read the filtered result as one processing instance, in order.
<QueryList>
  <Query Id="0" Path="Application">
    <Select Path="Microsoft-Windows-GroupPolicy/Operational">
      *[System/Correlation/@ActivityID='{INSERT ACTIVITY ID HERE}']
    </Select>
  </Query>
</QueryList>
Copy the Activity ID value without its opening and closing braces. Keep the braces already present in the XML query and replace only the placeholder text. Every sign-in, startup, or refresh creates a new Activity ID, so update the custom view after each new test.
Step 5: Interpret the Operational Events
These event IDs are common routing points once the log is filtered to one Activity ID:
| Event ID | What it generally indicates |
|---|---|
| 4016 | A client-side extension began processing |
| 5016 | A client-side extension completed its Group Policy processing call; inspect the return value and extension-specific log before assuming every setting finished synchronously |
| 5312 | The applicable GPOs the Group Policy service selected for processing in that instance |
Other start, completion, timing, and failure events vary by processing type and Windows version. Read the event text and provider details rather than relying on the number alone. The log also records denied GPOs and denial reasons as part of the same processing instance, without needing to memorize a specific event number for that behavior.
Step 6: Identify the Correct Group Policy Failure Branch
Once RSoP and the event logs point to a category, use the evidence to choose the correct troubleshooting branch. A wrong winner is a different problem than a missing GPO, and a refresh failure is a different problem than either.
Group Policy processing follows LSDOU, Link Order decides precedence among links on the same container, and Enforced links survive Block Inheritance. The dedicated precedence guide linked in the table below covers the full chain and worked examples.
| What the evidence shows | Route to |
|---|---|
| Expected GPO missing or filtered from the applied set | GPO Not Applying |
| GPO shows Denied (Security) or an unclear filtering result | GPO security filtering |
| Wrong GPO wins a setting conflict | Group Policy precedence |
| User settings change depending on which computer they sign into | Group Policy loopback processing |
gpupdate /force fails or gets stuck | GPUpdate /Force Not Working |
Event ID 1058 or a gpt.ini retrieval error | Group Policy Event ID 1058 |
| GPO applies, but a specific MSI or application does not install | Application deployment troubleshooting example |
Need full gpresult switch and syntax reference | GPResult command guide |
Once the failure category is clear, use the dedicated guide for the detailed diagnosis and fix.
Step 7: Escalate to Infrastructure When the Evidence Points There
GPO troubleshooting reaches the infrastructure layer when multiple objects are affected, when Event ID 1058 or 1129 appears, or when different domain controllers enumerate different GPOs.
Client-to-domain checks
Run the following checks from an elevated PowerShell session; Test-NetConnection is a PowerShell cmdlet and is not recognized in a plain Command Prompt:
nltest /dsgetdc:contoso.com
nslookup -type=SRV _ldap._tcp.dc._msdcs.contoso.com
Test-NetConnection dc01.contoso.com -Port 389
Confirm that the client uses internal AD DNS servers and can reach the DC named in the event. A successful TCP 389 test proves only that the port is reachable. It does not prove that LDAP bind, Kerberos authentication, the secure channel, or SYSVOL access succeeds.
SYSVOL access
Test the exact path shown in the Event ID 1058 details. For example:
\\dc01.contoso.com\SYSVOL\contoso.com\Policies\{GPO-GUID}\gpt.iniUse the domain controller, domain, and GPO GUID recorded in the failed event. Do not replace the named DC with the domain-based DFS path or another controller, because the failure may affect only one domain controller.
Domain-controller health
dcdiag /test:dns
repadmin /replsummary
Run dcdiag and repadmin from a domain controller or an administrative workstation with the required AD DS/RSAT tools and sufficient domain permissions. These commands are not normal client-side checks. Use the results to decide whether the issue belongs to DNS, AD replication, SYSVOL/DFSR, or one domain controller. Replace contoso.com and dc01.contoso.com above with the real AD DNS domain and DC.
Step 8: Use GPSvc Debug Logging Only When Needed
When the System, Application, and Operational logs don’t fully explain the failure, Group Policy Client service (GPSvc) debug logging adds detail that isn’t captured by default.
Back up the registry before enabling GPSvc debug logging. Verbose logging can reduce performance and consume disk space, so enable it only long enough to reproduce the issue.
if not exist "%windir%\debug\usermode" md "%windir%\debug\usermode"
reg add "HKLM\Software\Microsoft\Windows NT\CurrentVersion\Diagnostics" /v GPSvcDebugLevel /t REG_DWORD /d 0x00030002 /f
gpupdate /force
Review the resulting log at %windir%\debug\usermode\gpsvc.log, then disable it once the failure has been captured:
reg add "HKLM\Software\Microsoft\Windows NT\CurrentVersion\Diagnostics" /v GPSvcDebugLevel /t REG_DWORD /d 0x00000000 /fArchive the captured gpsvc.log with the matching System, Application, and Operational logs, then remove or rename the old log so a later investigation does not mix different processing sessions.
Step 9: Preserve Evidence Before Making Changes
Before renaming files, editing GPOs, or resetting local policy caches, open an elevated Command Prompt on the affected client and export the logs and RSoP evidence that contain the affected processing instance. Record the local time when the issue is reproduced so the matching System, Application, and Operational events can be isolated later.
wevtutil.exe export-log Application "%TEMP%\Application.evtx" /overwrite:true
wevtutil.exe export-log System "%TEMP%\System.evtx" /overwrite:true
wevtutil.exe export-log Microsoft-Windows-GroupPolicy/Operational "%TEMP%\GroupPolicy.evtx" /overwrite:true
reg export "HKLM\SOFTWARE\Microsoft\Windows NT\CurrentVersion\Winlogon\GPExtensions" "%TEMP%\GPExtensions.reg" /y
gpresult /h "%TEMP%\GPResult.htm" /f
gpresult /r > "%TEMP%\GPResult.txt"
When possible, export the existing logs before rerunning gpupdate /force, because the refresh creates a new Activity ID and can make the original failed instance harder to isolate. Preserving the exact state that produced the failure is useful if the first fix does not work or the same pattern appears again later.
Group Policy Troubleshooting Checklist
- Define the affected scope and recent changes before opening any tool.
- Capture GPResult or Group Policy Results for a fast RSoP view.
- Check System and Application events for Group Policy warnings or errors.
- Record the Activity ID from the relevant System event.
- Filter the Operational log to that Activity ID and read it as one processing instance.
- Identify the failure branch before changing any configuration.
- Escalate to DNS, SYSVOL, and replication only when the evidence supports it.
- Preserve logs and RSoP evidence before making changes.
- Use GPSvc debug logging only if the standard logs are insufficient.
- Make one change at a time, then verify again.
FAQ
What is the best first step in Group Policy troubleshooting?
Define the affected scope, then run a fast RSoP check with gpresult /r or Group Policy Results. Follow direct System-log evidence immediately if Windows has already recorded an error instead of waiting to finish the RSoP check first.
What tools are used for Group Policy troubleshooting?
GPResult and Group Policy Results for RSoP, Event Viewer for the System, Application, and Group Policy Operational logs, Group Policy Modeling for planning, and nltest, dcdiag, and repadmin for infrastructure checks. GPSvc debug logging is the deeper layer for cases the standard tools don’t explain.
What is the difference between Group Policy Results and Group Policy Modeling?
Group Policy Results, the same data gpresult reads, reflects actual RSoP data already processed on a real target. Group Policy Modeling simulates a predicted result for planning or testing and does not evaluate Local GPOs. Use Results to diagnose a live problem and Modeling to test a change before deploying it.
Where is the Group Policy Operational log?
In Event Viewer, under Applications and Services Logs > Microsoft > Windows > GroupPolicy > Operational. Filter it by the Activity ID from the relevant System log event rather than reading it unfiltered.
When should I enable GPSvc debug logging?
Only after the System, Application, and Operational logs don’t fully explain the failure. Back up the registry first, reproduce the issue, capture the log, then disable debug logging again. It is not a routine first step for a normal ticket.
Official Microsoft References
Group Policy Troubleshooting Series
8 articles – Workflow · Precedence · GPResult · GPUpdate · Filtering · Loopback · Events