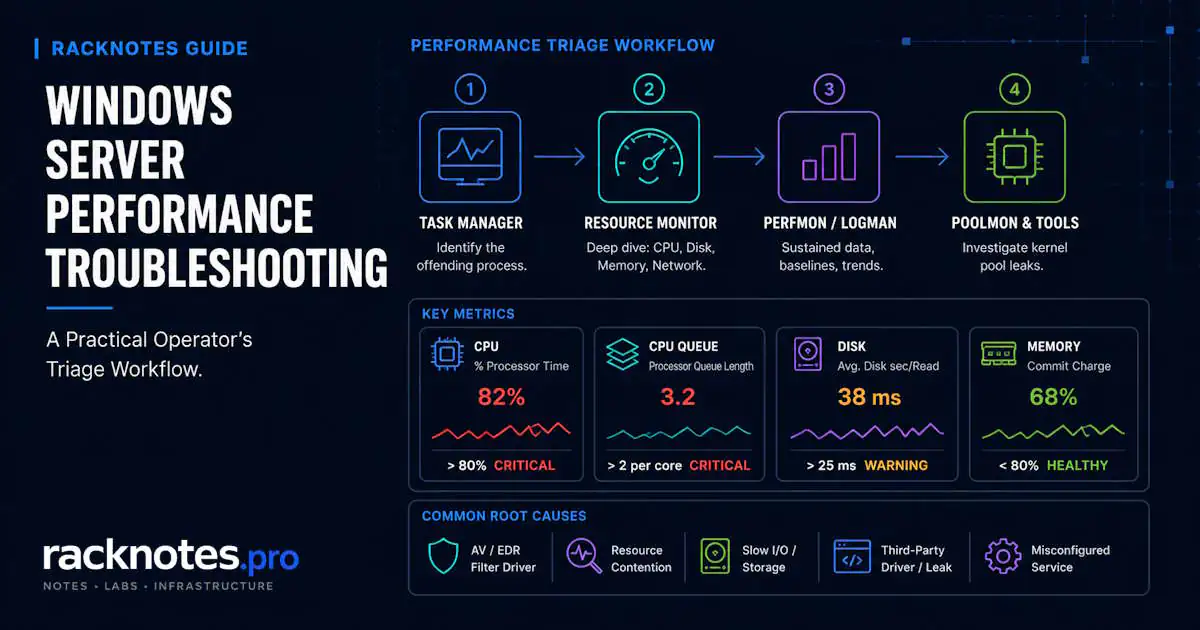
Windows server performance troubleshooting is not about memorizing counters. It is about knowing which tool answers which question — and escalating in the right order. Task Manager tells you what process. Resource Monitor tells you what that process is waiting on. Performance Monitor tells you the sustained trend. Poolmon tells you which driver is leaking kernel memory.
Most operators either stop at Task Manager or jump straight to perfmon. Both approaches to windows server performance troubleshooting are wrong. The escalation ladder is the workflow — and skipping rungs wastes time on problems that the previous tool would have answered in 30 seconds.
- Windows server performance troubleshooting follows a four-tool ladder: Task Manager → Resource Monitor → Perfmon → Poolmon. Escalate only when the current tool cannot answer the question.
- Sustained
% Processor Timeabove 80% is a bottleneck. High% Privileged Timewith low DPC/Interrupt time points to an AV/EDR minifilter driver, not an application. - High memory in Task Manager is often Standby cache — reclaimable on demand. Watch Commit charge and
Private Bytestrend, not working set. - Disk latency thresholds are media-dependent: HDD healthy below 15–20 ms, SSD below 5 ms, NVMe below 1–2 ms. The legacy 25 ms “warning” threshold is spinning-disk-era and meaningless for flash.
- Event ID 2019 or 2020 means kernel pool exhaustion. Use poolmon to identify the leaking driver — Event Viewer alone cannot tell you who holds the memory.
- Deploy a binary-circular Data Collector Set at 15-second intervals on every production server before you have an incident. Without a baseline, every threshold in this guide is a guess.
Quick Decision Matrix
Start here. The first step in any windows server performance troubleshooting session is matching the symptom to the right tool — not opening everything at once.
| Symptom | First Tool | Key Thing to Look For |
|---|---|---|
| High CPU — which process? | Task Manager | Sort by CPU, expand Service Host entries |
| Slow disk — which process causes it? | Resource Monitor → Disk tab | Response Time (ms) per process |
| Hung process | Resource Monitor → CPU tab | Analyze Wait Chain |
| High CPU sustained — trend and baseline? | Performance Monitor | Processor Queue Length, % Privileged Time |
| Server hangs, stops answering network | Event Viewer → Poolmon | Event ID 2019/2020, then pool tag |
| Memory “full” but app seems fine | Task Manager → Memory tab | Standby vs. Commit charge |
| Intermittent slowness — no obvious process | Performance Monitor (Data Collector Set) | Trend vs. baseline, Processor Queue Length |
The Triage Ladder: Task Manager → Resmon → Perfmon → Poolmon
Each tool in windows server performance troubleshooting answers a different question. The mistake is using a deep tool for a shallow question — or stopping at a shallow tool when the question requires depth.
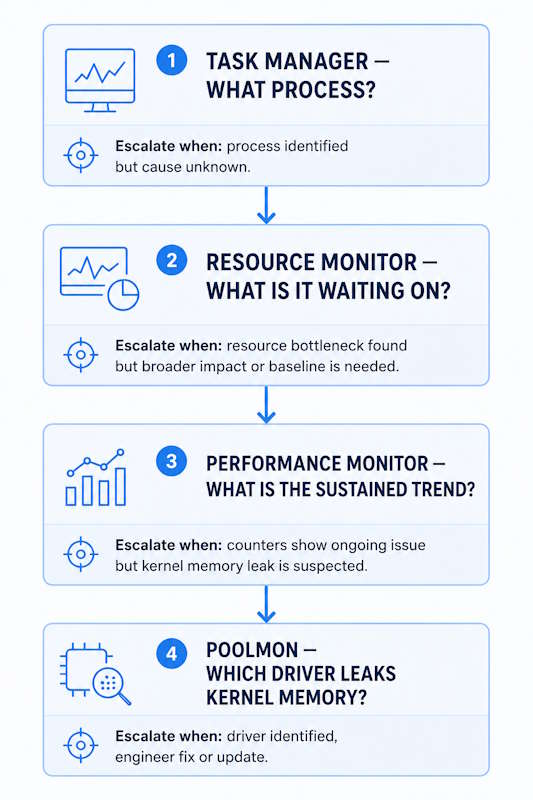
Task Manager — the 30-second triage. Open with Ctrl+Shift+Esc, click More details, sort the Processes tab by the suspect resource. Expand “Service Host” grouped entries to see hosted services. This answers what process — not why.
Resource Monitor (resmon) — escalate here when Task Manager identifies the process but not the cause. CPU tab shows the svchost-to-service map and wait chains. Disk tab shows per-process Response Time in milliseconds — the fastest way to confirm whether storage is the bottleneck. Memory tab shows hard faults per second and commit charge. Launch via resmon or Task Manager → Performance → Open Resource Monitor.
Performance Monitor (perfmon / logman) — reach for this when the problem is intermittent, you need a sustained trend against a baseline, or you need counters resmon does not surface: Processor Queue Length, % DPC Time, Pool bytes, TCP retransmits. Use the GUI for live graphs; use logman to script Data Collector Sets for baselining and incident capture.
Poolmon — only when Event ID 2019 or 2020 appears, or when Pool Nonpaged Bytes climbs steadily in perfmon and only drops on reboot. Perfmon can show how much nonpaged pool is in use — but not who holds it. That hand-off is poolmon’s job.
CPU: Finding the Real Cause of High Processor Time
Sustained % Processor Time above 80–85% means the server has no headroom for bursts. A short spike to 100% during a backup or antivirus scan is expected. A plateau that holds for minutes is a bottleneck. This is where most windows server performance troubleshooting sessions start — and where the most time gets wasted misidentifying svchost. Microsoft’s high CPU usage troubleshooting guidance is the authoritative reference for counter thresholds and the svchost isolation technique.
Key CPU Counters and Thresholds
| Counter | Healthy | Warning | Critical | Notes |
|---|---|---|---|---|
| % Processor Time | <50% | 50–80% | >80% | Sustained plateau, not momentary spikes |
| % Privileged Time | <30% | 30–50% | >50% | Kernel-mode activity — includes AV/EDR filter drivers |
| % DPC Time | <10% | 10–20% | >20% | High values point to NIC or storage driver issues |
| Processor Queue Length | <2 per core | 2–4 per core | >4 per core | Rule of thumb, not a hard Microsoft figure — corroborate with % Processor Time |
Processor Queue Length counts threads ready to run but waiting for a core. There is a single queue across all processors, so divide by the number of logical processors. The widely cited rule is investigate when the per-core average exceeds 2 — but this counter is sampled, not accounted, so it suffers from timing artifacts. Never diagnose a CPU bottleneck on queue length alone.
The svchost Breakout — Windows Server Performance Troubleshooting’s Most Skipped Step
High CPU attributed to svchost.exe is almost never svchost itself. It is a specific service hosted inside it — Windows Update (wuauserv), Delivery Optimization (DoSvc), Windows Search (WSearch), BITS, or WMI are the most common culprits on Windows Server.
- In Task Manager Processes tab, expand the high-CPU “Service Host” group — the child services are listed directly beneath it on Windows Server 2016 and later.
- Alternatively: right-click the high-CPU svchost in the Details tab → Go to service(s). This highlights the exact services sharing that PID in the Services tab.
- From the command line:
tasklist /svc | findstr "<PID>"lists all services in that process. - In Resource Monitor → CPU tab → Services column: shows which services are inside each svchost instance and their individual CPU contribution.
- To isolate a suspect service for attribution:
sc config <servicename> type= ownforces it into its own svchost. Revert withtype= shareafter diagnosis.
Security check: confirm the binary path is C:\Windows\System32\svchost.exe. A svchost.exe running from a user profile, AppData, or Temp directory is a malware indicator, not a performance problem.
High % Privileged Time — Where AV/EDR Hides
When % Privileged Time is high, DPC/Interrupt time is low, and the usage is attributed to System (PID 4) with no obvious user-mode culprit — that is the signature of an endpoint protection minifilter scanning a high-churn directory.
Kernel-mode time includes every driver running in the kernel — and your antivirus filter driver runs there. Microsoft’s performance guidance states this explicitly. The minifilter intercepts every file I/O operation, and on a server with a busy log directory, database write path, or mail spool, the overhead compounds quickly.
- Confirm DPC Time and Interrupt Time are both low. If either is high, the culprit is a NIC or storage driver, not a minifilter — update or rollback that driver first.
- Run
fltmc(Filter Manager control program) to list all registered minifilter drivers and their altitudes. Endpoint protection products typically appear near altitude 320000–329999 (antivirus) or 260000–269999 (activity monitor). - Add scoped exclusions for high-churn directories (database files, log directories, mail spools, backup staging areas) and measure whether
% Privileged Timedrops. - If exclusions produce a material improvement, work with the security team on permanent policy-based exclusions — do not disable protection.
Memory: Commit Charge Is the Real Signal
The default memory column in Task Manager shows Working Set — private bytes backed by physical RAM. High working set is often an application caching data legitimately. A memory leak looks different: Commit charge and Private Bytes climb unbounded over time without release, and the only fix is a restart. Effective windows server performance troubleshooting for memory problems requires watching the right counters — not the Task Manager default. Microsoft’s memory leak troubleshooting guidance covers the commit-vs-working-set distinction in detail.
Key Memory Counters
| Counter | Healthy | Warning | Critical |
|---|---|---|---|
| Available MBytes | >10% of RAM | <10% of RAM | <500 MB |
| % Committed Bytes In Use | 0–50% | 60–80% | >80% |
| Pages/sec (hard faults) | Baseline-relative | Sustained elevation with low Available MBytes | Hundreds/sec with low Available MBytes |
The memory bar in Resource Monitor shows In Use / Modified / Standby / Free. Standby is cached-but-reclaimable — Windows will reclaim it immediately if an application needs RAM. A server showing 90% “used” in Task Manager with most of that as Standby is not under memory pressure. A server showing 90% used with most of it as In Use and Commit charge approaching the Commit Limit is.
There is no universal threshold for Pages/sec. Some environments run 1,000 hard faults per second normally; others show real pressure at 50. Baseline this counter during normal operation and treat deviations as the signal, not absolute numbers.
Event ID 2019 and 2020: Kernel Pool Exhaustion
Event 2019 (nonpaged pool empty) and Event 2020 (paged pool empty) in the System log signal that the Server service failed to allocate kernel memory. The Server service is almost never the cause — it is the first component to notice that a leaking driver has consumed the pool.
Symptoms: server becomes sluggish, stops responding to network requests, but still pings. A reboot clears the symptom temporarily. Without fixing the leaking driver, it recurs.
Windows server performance troubleshooting for pool exhaustion requires poolmon — Event Viewer cannot identify the driver. The full workflow is in the poolmon section below. For context on these Event IDs and how they appear in the System log, see the Windows Server event log troubleshooting guide.
Disk: Latency Is the Only Metric That Matters
Disk Queue Length gets most of the attention in older performance guides. Latency — Avg. Disk sec/Read and Avg. Disk sec/Write — is the authoritative signal. Windows server performance troubleshooting for storage problems starts with latency, not queue depth. A queue can be long and latency acceptable on fast storage; a short queue with high latency is a bottleneck. Microsoft’s disk performance troubleshooting documentation confirms that Avg. Disk sec/Transfer counters are the primary indicator of storage health.
Disk Latency Thresholds by Media Type
| Storage Media | Healthy | Investigate | Critical |
|---|---|---|---|
| HDD (spinning) | <15 ms | 15–25 ms | >50 ms |
| SATA/SAS SSD | <1 ms | >5 ms | >10 ms |
| NVMe | <0.5 ms | >2 ms | >5 ms |
The 15/25/50 ms thresholds in Microsoft’s scenario guide are correct — for spinning disks. They are derived from 5,400 RPM rotation math. A 25 ms “warning” on NVMe means the device is performing roughly 50× slower than healthy. When doing windows server performance troubleshooting on flash storage, the legacy numbers will mask serious problems.
Disk Queue Length above 2 per physical spindle is the traditional warning. On SAN, virtualized storage, or NVMe arrays, queue length is nearly uninterpretable because the OS cannot see the real spindle count. Fall back to latency counters on those platforms.
In-guest disk latency on a VM can look severe while the guest OS is innocent. The real bottleneck may be queue depth contention on a shared LUN, a per-VM IOPS cap, or a noisy neighbor on the same datastore. In-guest perfmon shows the symptom; the cause lives at the hypervisor or array layer. Correlate with hypervisor-side metrics before buying hardware or changing guest configuration.
Poolmon: Diagnosing Kernel Pool Leaks
Poolmon ships in the Windows Driver Kit (WDK). It is the only tool that maps nonpaged and paged pool consumption to the four-character tags that identify kernel allocations.
- Open poolmon.exe from the WDK install path (typically
C:\Program Files (x86)\Windows Kits\10\Tools\x64\poolmon.exe). - Press P once for nonpaged pool (Event 2019), twice for paged pool (Event 2020).
- Press B to sort by bytes consumed. The tag at the top of the list is the likely offender. Take snapshots every 30 minutes — a growing tag confirms a leak.
- Map the tag to a driver. Run
findstr /s /m /l [TAG] C:\Windows\System32\drivers\*.sys. Alternatively, openpooltag.txtin the WDK triage folder — it maps known Microsoft and common vendor tags to driver names. - Update, rollback, or replace the driver identified. If it is an optional component, disable it via
sc config <driver> start= disabledand reboot to confirm the pool stabilizes.
Common leaking drivers in production environments: third-party NIC drivers (especially Killer Network and some MSI adapters conflicting with the NDU driver at %WinDir%\System32\drivers\Ndu.sys), antivirus minifilters, and storage filter drivers. The NDU driver — Windows Network Data Usage monitoring — is a documented leak source with certain NIC combinations and can be disabled if the feature is not needed.
Performance Monitor: Baselining and Incident Capture
Perfmon is the right tool for windows server performance troubleshooting when the problem is intermittent, when you need a sustained trend, or when you need counters that resmon does not surface. The GUI is useful for live ad-hoc graphs. logman is the operator tool for scripted Data Collector Sets.
Deploy a Baseline Data Collector Set Before Any Incident
A binary-circular log at 15-second intervals costs almost nothing in overhead and gives you something to compare against when a problem appears. Without it, every counter reading is a guess about what “normal” looks like.
# Create a binary-circular baseline collector (runs continuously, overwrites itself)
logman create counter BASELINE ^
  -f bincirc ^
  -max 500 ^
  -si 15 ^
  -o "C:\PerfLogs\SERVERBASELINE" ^
  -c "\Processor(*)\% Processor Time" ^
     "\Processor(*)\% Privileged Time" ^
     "\Processor(*)\% DPC Time" ^
     "\System\Processor Queue Length" ^
     "\System\Context Switches/sec" ^
     "\Memory\Available MBytes" ^
     "\Memory\% Committed Bytes In Use" ^
     "\Memory\Pages/sec" ^
     "\Memory\Pool Nonpaged Bytes" ^
     "\Memory\Pool Paged Bytes" ^
     "\PhysicalDisk(*)\Avg. Disk sec/Read" ^
     "\PhysicalDisk(*)\Avg. Disk sec/Write" ^
     "\PhysicalDisk(*)\Avg. Disk Queue Length" ^
     "\Network Interface(*)\Bytes Total/sec" ^
     "\Process(*)\% Processor Time" ^
     "\Process(*)\Private Bytes" ^
     "\TCPv4\Segments Retransmitted/sec"

logman start BASELINE
logman query BASELINE
For active incident capture — tighter interval, shorter window:
# Incident capture — 5-second interval, 250 MB cap
logman create counter INCIDENT ^
  -f bincirc -max 250 -si 5 -v mmddhhmm ^
  -o "C:\PerfLogs\INCIDENT" ^
  -c "\LogicalDisk(*)\*" "\Memory\*" "\Network Interface(*)\*" ^
     "\PhysicalDisk(*)\*" "\Process(*)\*" "\System\*" "\Thread(*)\*"

logman start INCIDENT
# Reproduce the problem, then:
logman stop INCIDENT
Read the BLG file by double-clicking it in perfmon, or convert to CSV with relog C:\PerfLogs\BASELINE.blg -f csv -o C:\PerfLogs\baseline.csv.
Perfmon graphs summarize to roughly 1,000 data points regardless of collection interval. A 5-second capture viewed over 24 hours gets heavily averaged, hiding spikes. Keep incident captures short — 15–30 minutes around the event — and analyze the raw BLG rather than the smoothed chart.
Resource Monitor: The Underused Workhorse
Resource Monitor sits between Task Manager and perfmon in the windows server performance troubleshooting ladder — it provides per-process detail that Task Manager lacks and requires no counter configuration. Most operators skip it entirely.
CPU tab: Shows Services column (the svchost breakout), Associated Handles (search by filename to find which process locks a file), and Associated Modules (loaded DLLs). Right-click any process → Analyze Wait Chain to see what it is blocked on and which process owns the resource.
Disk tab: Per-process total bytes/sec and — the key field — Response Time in milliseconds. This is the fastest way to confirm whether a specific process is experiencing slow I/O or whether the storage stack itself is slow for everyone. If Response Time is elevated across all processes, the issue is at the storage layer — see Windows Server Storage Troubleshooting for the disk-level diagnostic sequence.
Memory tab: Per-process Hard Faults/sec, Commit, and Working Set. The physical memory bar shows In Use / Modified / Standby / Free. Standby is reclaimable — do not mistake it for a shortage.
Network tab: Per-process Send/Receive bytes/sec, TCP Connections with latency, and Listening Ports. Useful for identifying which process is saturating the NIC or maintaining an unexpected number of connections.
Network: When Bytes Per Second Are Not the Problem
Network saturation is straightforward: Network Interface \ Bytes Total/sec above 80% of NIC capacity is a problem. A 1 Gbps NIC tops out near 125 MB/sec — monitor against that ceiling, not an abstract number.
TCP retransmits are the more nuanced signal. A few retransmits on a busy LAN are normal noise. A sustained rate climbing above 0.5–1% of segments transmitted warrants investigation — check cabling, NIC driver version, duplex settings, and TCP offload configuration. netstat -s shows cumulative retransmit counts; the perfmon counter TCPv4 \ Segments Retransmitted/sec tracks the rate.
# Network interface utilization check
Get-NetAdapterStatistics | Select-Object Name,ReceivedBytes,SentBytes

# TCP retransmit rate (cumulative)
netstat -s | findstr /i "retransmit"

# Perfmon one-liner for current TCP retransmit rate
(Get-Counter "\TCPv4\Segments Retransmitted/sec").CounterSamples.CookedValue
Windows Server Performance Troubleshooting: Four Operator Scenarios
These are the four most common windows server performance troubleshooting situations — each with a different root cause, a different tool, and a different resolution path.
Scenario 1 — High CPU Caused by Windows Update
The server hits 80–90% CPU during business hours. Task Manager shows wuauserv, TrustedInstaller, or DoSvc (Delivery Optimization) at the top. This is expected during patch download and installation — Windows Update drives CPU, disk, and network simultaneously while staging patches.
If the spike is transient and the server recovers cleanly: no action needed. If wuauserv is pegged continuously at high CPU during non-patch periods: the update cache is likely corrupted. Stop wuauserv and BITS, rename C:\Windows\SoftwareDistribution to SoftwareDistribution.old, restart both services. Run DISM /Online /Cleanup-Image /RestoreHealth and sfc /scannow to repair CBS before the next update cycle.
Scenario 2 — Event ID 2019 Caused by NIC Driver Leak
The server responds normally for several days, then gradually slows and eventually stops answering network requests. It still pings. Event 2019 (Source: Srv) appears in the System log. A reboot fixes it for another few days.
Launch poolmon, press P (nonpaged), press B (sort by bytes). Watch the top tag over 30-minute intervals — it grows steadily. Run findstr /s /m /l [TAG] C:\Windows\System32\drivers\*.sys. In a common variant of this scenario, the tag maps to the NDU driver or a NIC vendor driver. Disable NDU (sc config Ndu start= disabled, reboot) or update/rollback the NIC driver. Confirm the pool stabilizes by watching Memory \ Pool Nonpaged Bytes in perfmon over the next 48 hours.
Scenario 3 — Slow VM Caused by Shared SAN Latency
A VM on a shared host reports slow application response. In-guest perfmon shows Avg. Disk sec/Read at 80–120 ms — far above the HDD threshold, let alone SSD. The guest OS looks healthy: CPU and memory are fine, no error events in the System log.
The mistake is buying faster disks for the guest. The bottleneck is at the hypervisor or array layer — a noisy neighbor on the same datastore, a per-VM IOPS cap, or a host-level storage queue saturated by concurrent backups. Check hypervisor-side storage metrics (vSphere Storage I/O Control, Hyper-V storage QoS, array-side latency), identify the contention source, and resolve at that layer. In-guest disk latency is the symptom; the cause is invisible from inside the VM.
Scenario 4 — High % Privileged Time Caused by EDR Scanning
A file server shows sustained % Privileged Time at 40–60%. DPC Time and Interrupt Time are both below 5%. System (PID 4) is the top process in perfmon per-process view. No user-mode application is obviously responsible.
Run fltmc — the endpoint protection product appears in the minifilter list near altitude 320000. The EDR agent is scanning every file write on a volume receiving thousands of writes per minute (log directory, temp files, user shares). Add scoped exclusions for the high-churn directories, verify % Privileged Time drops materially, then formalize the exclusions through the security policy. Do not disable the agent.
Final Thoughts
Windows server performance troubleshooting has a tooling answer for almost every symptom — provided you reach for the right tool in the right order. Task Manager identifies the process. Resource Monitor tells you what the process is waiting on and how slow its disk I/O is. Perfmon tracks the sustained trend against a baseline you built before the incident. Poolmon maps a kernel pool leak to the driver responsible.
The single most valuable thing you can do before the next incident is deploy the logman baseline collector above on every production server. The second most valuable is raising default log sizes and setting up Windows Event Forwarding — covered in the companion Windows Server event log troubleshooting guide. For storage failures that progress beyond latency into data loss or disk replacement, the recovery path starts with Windows Server Backup and Bare Metal Recovery with wbadmin.
Most performance problems in SMB environments fall into four categories: a misbehaving hosted service inside svchost, an AV/EDR minifilter consuming kernel time, a kernel pool leak from a third-party driver, or storage latency that originates below the guest OS. All four are diagnosable with the tools above — the question is whether you reach for them in the right order.
Frequently Asked Questions
What is normal CPU usage on Windows Server?
Below 50% sustained is healthy and leaves headroom for bursts. 50–80% is a warning range worth monitoring. Sustained above 80–85% means the server is CPU-bound — it has no capacity for unexpected load. Short spikes to 100% during backups, patch installs, or index rebuilds are normal; a plateau that holds for minutes is the problem.
What causes high % Privileged Time on Windows Server?
High kernel-mode time with low DPC/Interrupt time is almost always an endpoint protection minifilter — antivirus or EDR — intercepting file I/O on a high-churn volume. Run fltmc to enumerate minifilter drivers. If DPC or Interrupt time is also elevated, the culprit is a NIC or storage driver rather than a filter driver — update or rollback that driver first.
When should I use Resource Monitor instead of Task Manager?
Use Resource Monitor when Task Manager has identified the process but not the cause. Resource Monitor adds per-process disk Response Time in milliseconds, the svchost-to-service map in the Services column, Associated Handles (useful for finding which process locks a file), and Wait Chain analysis for hung processes. It answers what the process is waiting on — Task Manager only answers which process is consuming resources.
How do I identify a memory leak on Windows Server?
Watch Commit charge and Private Bytes over time, not the working set column Task Manager shows by default. A legitimate cache grows large but stabilizes; a leak grows continuously without release. In perfmon, monitor Process \ Private Bytes per process and Memory \ Pool Nonpaged Bytes. If pool bytes climb steadily and only drop on reboot, launch poolmon to identify the leaking driver by pool tag.
What is Event ID 2019 and how do I fix it?
Event 2019 (Source: Srv, System log) means the Server service could not allocate from the nonpaged pool because it was empty. The Server service is the messenger, not the cause. A leaking kernel driver — most commonly a NIC driver, NDU driver, or antivirus minifilter — has consumed the pool over hours or days. Fix: use poolmon to identify the leaking tag, map it to a driver with findstr, then update, rollback, or disable that driver.
What disk latency is acceptable in windows server performance troubleshooting?
It depends entirely on the storage media. HDD: healthy below 15–20 ms, investigate above 25 ms. SATA/SAS SSD: investigate above 5 ms. NVMe: investigate above 1–2 ms. The Microsoft-documented 15/25/50 ms thresholds derive from spinning-disk math and are meaningless for flash — a 25 ms “warning” on NVMe represents roughly 50× slower than healthy operation. Always compare against a per-device baseline, not a fixed table.
What does Processor Queue Length mean and what is a good value?
Processor Queue Length counts threads that are ready to run but waiting for a CPU core. Divide the value by the number of logical processors to get a per-core figure. The widely cited rule is investigate when the per-core average sustains above 2. This counter is sampled rather than accumulated, so it is prone to timing artifacts — never diagnose a CPU bottleneck on queue length alone. Corroborate with sustained % Processor Time above 80%.
Windows Server Operations Series
8 articles — Event Logs · Performance · Services · Remote Access · Network · Storage · Backup · Boot Recovery