
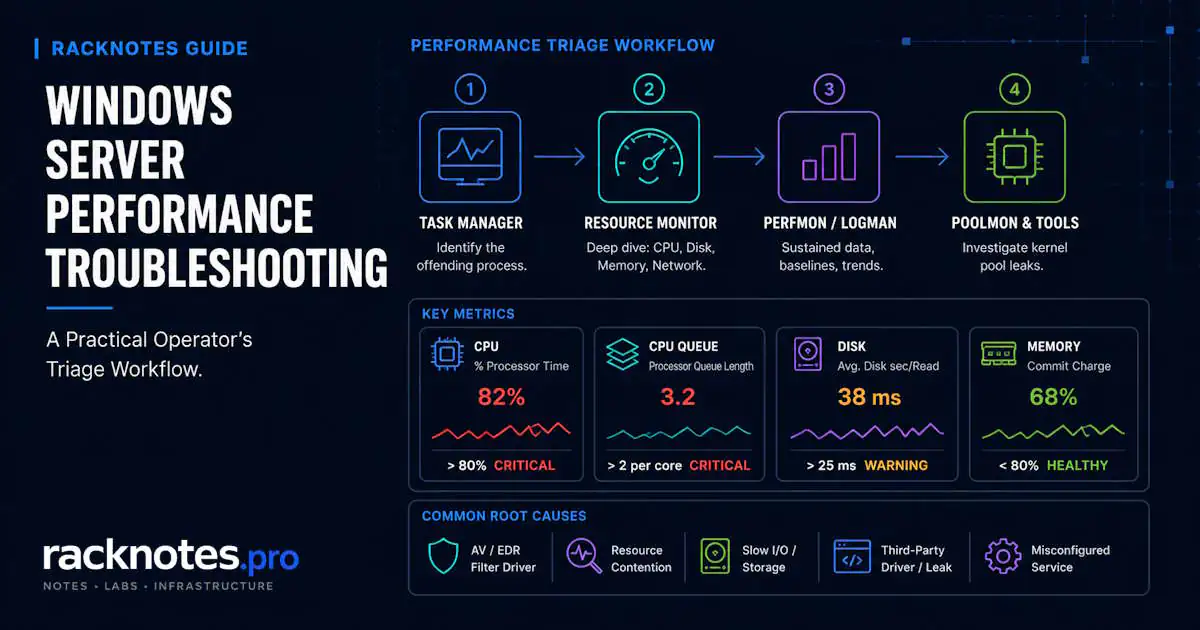
Windows Server performance troubleshooting starts with one question: which resource is actually constrained? A slow server, intermittent latency, or a stalling application could trace back to CPU, memory, disk, or network. Diagnosing the wrong one wastes time without fixing anything. This guide follows a practical workflow: take a quick snapshot, collect sustained data if the problem isn’t obvious, identify which subsystem is under pressure, correlate that pressure with a specific process, service, or event, and only then move to subsystem-specific troubleshooting.
- Start with Task Manager or Resource Monitor for the current state, not a deep tool
- Use Performance Monitor and Data Collector Sets when the problem is sustained or intermittent, not a one-time snapshot
- Compare what you see against a normal baseline for that specific server – a domain controller, SQL Server, and file server all have different normal profiles
- Confirm whether CPU, memory, disk, or network is actually the constrained resource before troubleshooting further
- Correlate the constrained resource with the process, service, or event responsible – a counter tells you what’s pressured, not why
- Don’t diagnose from a single counter or a single threshold
- Move to subsystem-specific troubleshooting, or a dedicated guide, only after the evidence identifies the bottleneck
How to Check Windows Server Performance
A repeatable process is more reliable than guessing. Microsoft’s own performance troubleshooting guidance follows the same resource-by-resource logic and distinguishes sustained behavior from brief spikes.
Step 1: Confirm the symptom and time window. “Slow” means something different depending on whether it’s constant, time-of-day-specific, or tied to a specific operation. Note when it started and how often it recurs.
Step 2: Check Task Manager. Ctrl+Shift+Esc, More details, sort Processes by the suspect resource. Expand “Service Host” entries to see what’s actually running inside a high-usage svchost. This answers what process, not why.
Step 3: Open Resource Monitor. Escalate here when Task Manager identifies a process but not the cause. The CPU tab maps services inside svchost and shows Wait Chain analysis for hung processes; the Disk tab shows per-process Response Time in milliseconds; the Memory tab shows hard faults and commit detail; the Network tab shows per-process bytes and connections.
Step 4: Capture Performance Monitor counters. Use the GUI for a live look, or a Data Collector Set if the problem is intermittent or you need a sustained trend that Resource Monitor doesn’t show, such as Processor Queue Length, % DPC Time, pool bytes, or TCP retransmits.
Step 5: Compare against baseline. A number means little without knowing what’s normal for this specific server’s role and workload.
Step 6: Identify the constrained subsystem. CPU, memory, disk, or network – based on which counters actually show sustained pressure, not a single reading.
Step 7: Correlate with process, service, or event activity. Once you know which resource is pressured, identify what’s causing it – a specific process, a scheduled task, a backup window, or an event log entry around the same time.
Windows Server Performance Monitoring Tools
| Tool | Best for | Limitation |
|---|---|---|
| Task Manager | Quick snapshot of current resource use | Little historical context |
| Resource Monitor | Per-process CPU/disk/network/memory detail | Limited long-term trend |
| Performance Monitor | Counters, trends, Data Collector Sets | Requires knowing which counters to select |
| Event Viewer | Correlating performance degradation with system/application events | Doesn’t measure performance directly |
| PowerShell | Repeatable, scriptable data collection | Requires knowing what to collect |
Specialized tools such as Poolmon, Windows Performance Recorder/Analyzer, and hypervisor or storage-array metrics come in only when the evidence points there. For routine diagnosis, start with the Windows tools already available on the server, then bring in specialized or external monitoring when the built-in evidence isn’t enough.
Windows Server Performance Monitor and Key Counters
Performance Monitor (perfmon) is the tool for sustained trends, intermittent problems, and counters Resource Monitor doesn’t surface. Use the GUI for live graphs; use logman to script Data Collector Sets for baselining and incident capture. A useful core set, grouped by resource:
CPU
Processor(_Total)\% Processor TimeProcessor(_Total)\% Privileged TimeSystem\Processor Queue Length
Memory
Memory\Available MBytesMemory\% Committed Bytes In UseMemory\Pages/secProcess(*)\Private Byteswhen investigating growth in a specific process
Disk
PhysicalDisk(*)\Avg. Disk sec/ReadPhysicalDisk(*)\Avg. Disk sec/Write- Throughput/IOPS counters where useful for context
Network
Network Interface(*)\Bytes Total/sec- Errors/discards where relevant
- Retransmits only when a network symptom actually warrants it
What matters is the pattern relative to that server’s own baseline: a plateau that holds, a trend that climbs without releasing, or a value well outside what’s normal for the workload. Treat any reference value as an investigation trigger, not a universal pass/fail threshold.
Establish a Windows Server Performance Baseline
A domain controller, a SQL Server, a file server, and a backup server all have different normal resource profiles. A single snapshot can’t tell you whether what you’re seeing is a normal peak or actual degradation; a baseline can. Microsoft’s guidance on Performance Monitor data collection covers the mechanics behind Data Collector Sets in more depth.
# Binary-circular baseline collector - modest counter set, overwrites itself
logman create counter BASELINE ^
  -f bincirc ^
  -max 500 ^
  -si 15 ^
  -o "C:\PerfLogs\SERVERBASELINE" ^
  -c "\Processor(_Total)\% Processor Time" ^
     "\Processor(_Total)\% Privileged Time" ^
     "\System\Processor Queue Length" ^
     "\Memory\Available MBytes" ^
     "\Memory\% Committed Bytes In Use" ^
     "\Memory\Pages/sec" ^
     "\PhysicalDisk(*)\Avg. Disk sec/Read" ^
     "\PhysicalDisk(*)\Avg. Disk sec/Write" ^
     "\Network Interface(*)\Bytes Total/sec"

logman start BASELINE
The -f bincirc, -max, -si, -o, and -c options match current logman create counter syntax. This collector is only a starting point. Adjust the counter set and interval to the server’s role and workload, since overhead depends on counter count, sample interval, and how many instances a wildcard expands to. The important part is having a recent baseline before an incident, so every threshold is a comparison rather than a guess.
Troubleshoot High CPU
The goal here is narrowing CPU down to a process or service, not repairing every possible cause.
Sustained % Processor Time well above normal, holding for minutes rather than spiking briefly, is worth investigating. A short spike during a backup or scan can be expected; a plateau with no headroom for bursts deserves attention. Treat any specific percentage as an investigation trigger relative to that server’s baseline, not a universal pass/fail line.
High CPU attributed to svchost.exe usually means one of its hosted services is responsible. Expand the “Service Host” grouping in Task Manager, or right-click the process in the Details tab and choose Go to service(s). From the command line, tasklist /svc | findstr "<PID>" lists everything running in that process. Resource Monitor’s CPU tab Services column shows the same mapping with per-service CPU. Confirm the binary path is C:\Windows\System32\svchost.exe first. Anything running from a user profile or Temp directory is a security concern rather than a normal performance case.
% Privileged Time is kernel-mode CPU, and it can come from many sources. When it’s high, check % DPC Time and % Interrupt Time alongside it. If either is also elevated, a NIC or storage driver becomes a stronger suspect than a filter driver. If both stay low while privileged time is high, a kernel-mode component such as an antivirus or EDR minifilter is one plausible explanation, not an automatic conclusion. fltmc lists registered minifilter drivers if that line of investigation is warranted. Confirm with additional evidence before naming a specific driver as the cause.
Troubleshoot Memory Pressure
Used RAM or a large working set does not prove a memory leak. Working Set shows memory currently resident in physical RAM; it can include shared as well as private pages and is not equivalent to process commitment. Private Bytes and system commit show a different part of the picture. For leak investigation, look for a persistent upward trend under comparable workload rather than one large snapshot.
Watch Available MBytes relative to that server’s normal range, % Committed Bytes In Use, and Private Bytes trend for a specific process. A legitimate cache often grows and then stabilizes. A leak usually shows a persistent upward trend without returning toward baseline under comparable workload; whether resolving it requires a process restart, service restart, driver remediation, or full reboot depends on where the leak actually occurs. Resource Monitor’s memory bar (In Use / Modified / Standby / Free) helps distinguish reclaimable Standby cache from actual pressure – a server showing high “used” memory that’s mostly Standby isn’t under pressure the way one approaching its Commit Limit is.
Treat Pages/sec as paging activity that needs context, not simply a count of application hard faults – Microsoft’s own memory management guidance calls it one of the more misunderstood counters. High values alone don’t prove insufficient RAM; correlate them with commit, available memory, and workload behavior, and baseline the number rather than judging it against an absolute figure.
If nonpaged or paged pool grows continuously and only drops on reboot, that’s a kernel pool exhaustion symptom, not an application memory leak. Event ID 2019 indicates that the Server service couldn’t allocate from the nonpaged pool because it was exhausted; Event ID 2020 is the corresponding paged-pool condition. Treat either event as evidence of pool exhaustion and investigate which component is consuming the pool rather than assuming the Server service itself is responsible. That’s a conditional branch into a specialized tool (Poolmon), covered below, not something every memory investigation needs. For how these events appear in context, see Windows Server Event Log Troubleshooting.
Troubleshoot Disk and Storage Performance
Latency, especially Avg. Disk sec/Read and Avg. Disk sec/Write, is generally more useful than queue length for identifying a storage bottleneck, particularly on SAN, virtualized, or NVMe storage where the OS cannot see the real device layout behind the queue. A short queue with high latency can still indicate a problem; a longer queue with acceptable latency on fast storage may not.
Acceptable latency depends heavily on the media, RAID/controller, SAN architecture, caching, and workload behind it. There is no single number that applies equally to HDD, SATA/SAS SSD, NVMe, and virtualized storage. Compare against that volume’s own baseline rather than a fixed table.
In-guest latency on a VM can look severe while the guest OS itself is healthy – the real bottleneck may be queue contention on a shared datastore, a per-VM IOPS cap, or a noisy neighbor at the hypervisor or array layer. In-guest Performance Monitor shows the symptom; the cause often isn’t visible from inside the guest. Correlate with hypervisor- or array-side metrics before changing guest configuration or buying faster disks.
For deep storage diagnosis beyond identifying disk as the bottleneck, see Windows Server Storage Troubleshooting.
Troubleshoot Network Performance
Start with utilization:
Get-Counter "\Network Interface(*)\Bytes Total/sec"Compare the rate against the interface’s negotiated link speed rather than an abstract number – a 1 Gbps NIC tops out near 125 MB/sec.
Interface errors or discards justify a closer network-path check. Depending on the counter and adapter, the cause can be physical, driver-related, configuration-related, or queue/congestion pressure. TCP retransmits are more nuanced: a few on a busy network can be normal, while a sustained elevated rate is worth investigating. Check cabling, NIC driver version, duplex settings, and offload configuration as appropriate, but do not treat one retransmit percentage as a universal threshold.
# Cumulative TCP retransmit counts
netstat -s | findstr /i "retransmit"
Once utilization or retransmits point to the network, move to per-process detail in Resource Monitor’s Network tab before touching NIC configuration or drivers.
Correlate Performance Counters with Processes and Events
A counter tells you what resource is under pressure. It doesn’t tell you why on its own.
Once a subsystem is identified, use Task Manager or Resource Monitor’s per-process view to find the specific process, PerfMon’s Process(*) instances if you’re already collecting counters, service mapping for anything hosted in svchost, and Event Viewer or application logs to check whether the pressure lines up with a scheduled task, backup window, update cycle, or logged error. This is the step that turns “disk is busy” into “this backup job is driving the disk load.”
Intermittent Performance Problems: Use a Data Collector Set
Live tools only show what’s happening right now. If an intermittent problem is absent when you open Task Manager, capture counters continuously or across the incident window instead:
# Tighter interval for active incident capture
logman create counter INCIDENT ^
  -f bincirc -max 250 -si 5 -v mmddhhmm ^
  -o "C:\PerfLogs\INCIDENT" ^
  -c "\Processor(_Total)\*" "\Memory\*" "\PhysicalDisk(*)\*" "\Network Interface(*)\*"

logman start INCIDENT
# Reproduce the problem, then:
logman stop INCIDENT
Keep incident captures focused: use a tighter interval and a shorter window around the actual event instead of collecting every available counter all day. Read the resulting BLG file in Performance Monitor, or convert it with relog for further analysis. Compare the captured window against your baseline rather than an assumed number.
When to Use Specialized Tools
Use these only when the evidence from the earlier steps points to them, not as a default part of every session.
Poolmon. Use when kernel nonpaged or paged pool is growing continuously, or Event ID 2019/2020 points to pool exhaustion. Poolmon (from the Windows Driver Kit) maps pool consumption to tags that can help identify the responsible driver. Event Viewer alone cannot do that. Once the tag is mapped to a driver, the resolution depends on the component involved: update it, roll back a recent change, reconfigure it, or escalate to the vendor.
Windows Performance Recorder / Analyzer. Use when standard counters show a problem but don’t identify the responsible code path in enough detail to act on.
Hypervisor or storage-array metrics. Use when a VM shows storage or CPU contention that may originate outside the guest itself.
Windows Server Performance Troubleshooting Checklist
- Define the symptom and time window
- Snapshot current resource use (Task Manager / Resource Monitor)
- Identify CPU, memory, disk, or network pressure
- Collect counters over time if the problem is intermittent
- Compare against baseline
- Identify the responsible process or service
- Correlate with event log activity
- Investigate the relevant subsystem, or hand off to a dedicated guide
- Verify improvement using the same metrics you started with
FAQ
How do I check Windows Server performance?
Start with Task Manager or Resource Monitor for a current snapshot, then Performance Monitor if the problem is sustained or intermittent. Compare against a baseline for that server’s role, identify which resource (CPU, memory, disk, network) is actually constrained, then correlate that with the responsible process, service, or event.
What should I monitor in Windows Server Performance Monitor?
CPU (% Processor Time, % Privileged Time, Processor Queue Length), memory (Available MBytes, % Committed Bytes In Use, Pages/sec), disk (Avg. Disk sec/Read and /Write), and network (Bytes Total/sec, errors/discards, retransmits when relevant). Add process-level counters when narrowing down to a specific culprit.
What are the most important Windows Server performance counters?
A small set covers most triage: % Processor Time, % Privileged Time, Processor Queue Length for CPU; Available MBytes and Pages/sec for memory; Avg. Disk sec/Read and /Write for storage; Bytes Total/sec for network. Beyond that, add counters based on what the initial pass points to, rather than collecting everything available.
How do I troubleshoot a slow Windows Server?
“Slow” isn’t a diagnosis by itself; localize it first. Check Task Manager, then Resource Monitor, to determine whether CPU, memory, disk, network, or a specific process or service is responsible, then investigate that subsystem.
What is a good CPU usage level on Windows Server?
There’s no single universal number. What matters is sustained saturation with little headroom for bursts compared with that server’s own baseline and workload. A short spike during a backup can be normal; a plateau that holds for minutes deserves investigation regardless of the exact percentage.
How do I tell whether Windows Server has a memory problem?
Don’t rely on Task Manager’s default Working Set view alone. It shows resident memory, not commitment or proof of a leak. Watch Available MBytes, Committed Bytes, and the Private Bytes trend for a specific process over time. A legitimate cache often stabilizes; a leak shows a persistent upward trend that does not return toward baseline under comparable workload. Distinguish reclaimable Standby cache from actual commit pressure in Resource Monitor.
How do I diagnose intermittent performance problems?
Live tools miss issues that aren’t happening the moment you check. Use a Performance Monitor Data Collector Set (logman) to capture counters continuously or across the incident window, then compare the captured data against your baseline rather than relying on a one-time snapshot.
Windows Server Operations Series
8 articles — Event Logs · Performance · Services · Remote Access · Network · Storage · Backup · Boot Recovery